As an International student, my primary form of communication with family and friends is through WhatsApp. During the last 4 years at IUPUI, I travelled back to New Delhi, India, every year during Summer Break and Winter Break. I chose to take this opportunity to learn more about my communication skills. By examining the Chat Data with my mom, I wanted to answer the following questions:
I collected the data by exporting my chat history from WhatsApp. According to Express, a maximum of 40,000 messages can be exported from a chat when choosing to export without media. Media accounts for larger chunks of the data and therefore doesn't allow enough space to go beyond about 10,000 messages in chat history. Using RegEx, the text was extracted and a functional dataset was built. This allowed for
I chose to start with my mom. If I'm texting someone through WhatsApp, chances are it's my mother. I text her atleast 10 times a day. The data, however, did not agree with me...
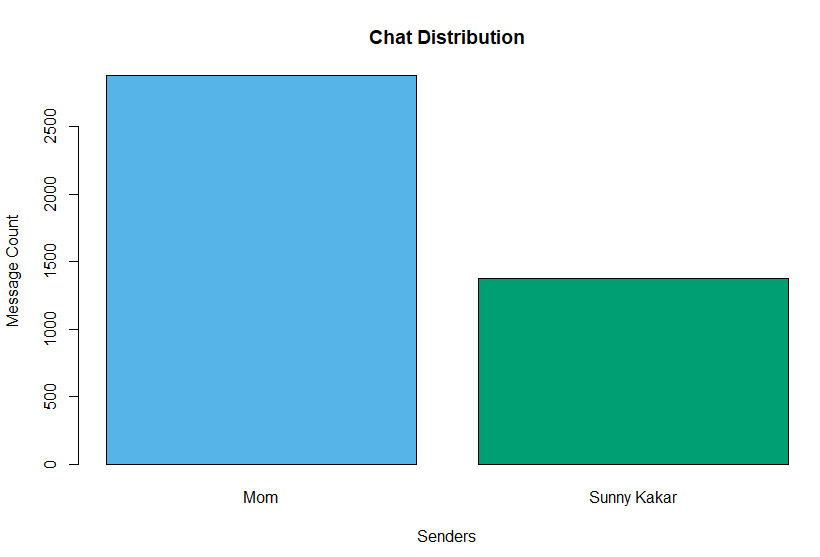
I was surprised to find out that not only does my mother text me more often than I text her, she does it twice as much!
A better indicator of chat patterns would be an overall view of the data regardless of the sender. I felt I still talk to her frequently over the phone/text when I'm not in the states. The data exported spanned from August 2017 to February 2020. This allowed for a uniform dataset which can be compared for patterns every year given that I travel back during summer and winter break. When we visualize that data, we see the following:
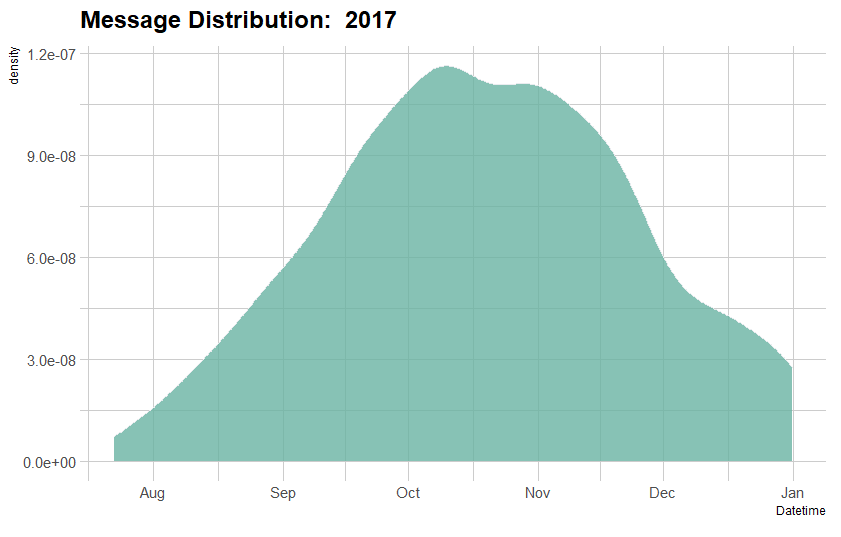
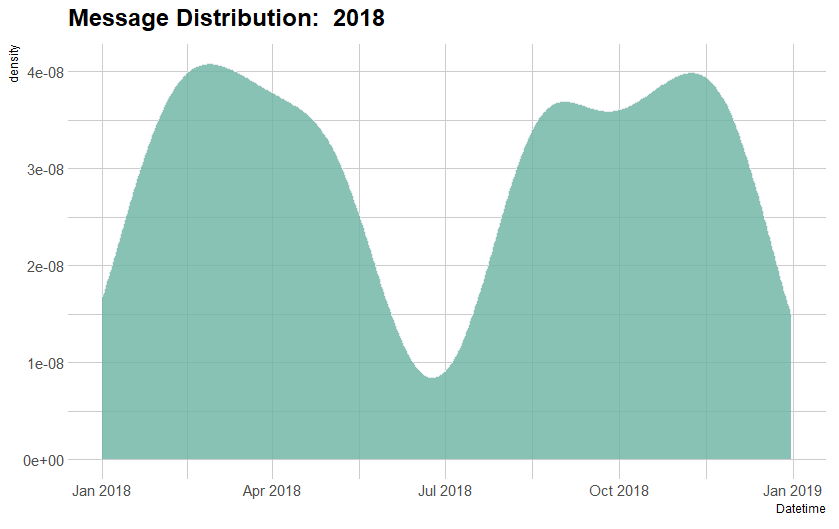
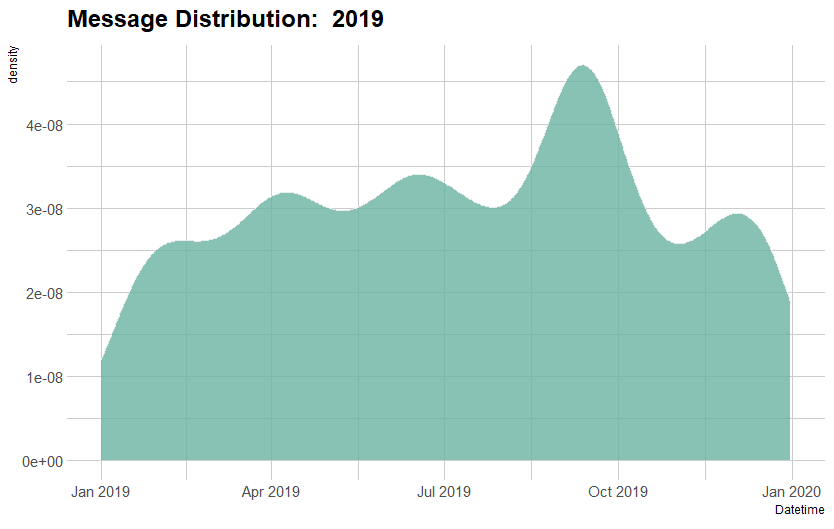
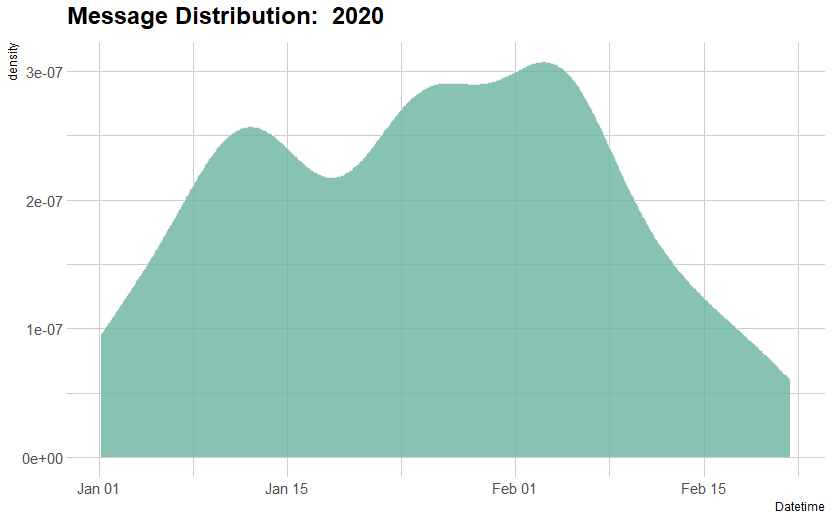
4 density graphs, one for each year, shows that there's a significant dip in frequency of texts sent starting May to August and December to January. This marks the duration of summer and winter breaks. 2019 shows no dip during Summer break as during this break, I started my first developer job and chose to stay in the States over travelling back home.
To understand this data better, we need to compare the month-wise text density with each year.
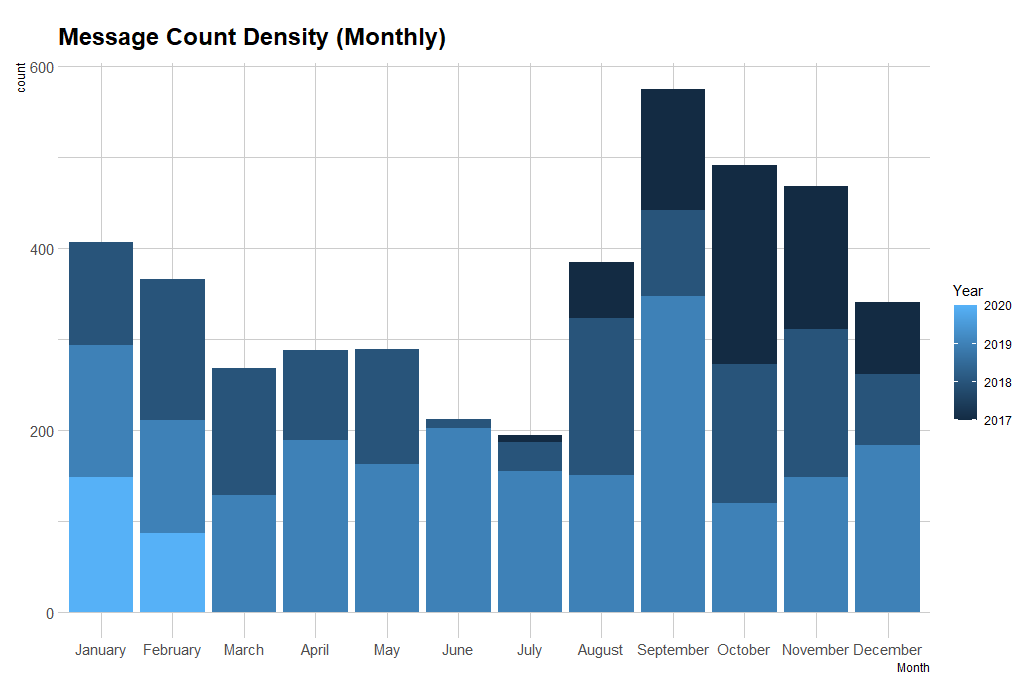
This graph shows key information such as:
(Interactive version for this graph can be found here )
After learning that I texted her half as much as she texts me, the next question is if there is a correlation in how we text. For that reason, we plotted a scatterplot and observe:
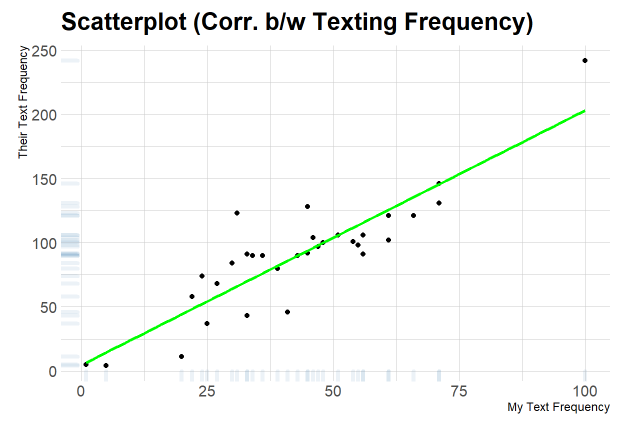
We plot the same and see a clear correlation between the two. In months that my mum texted me more, I also texted more. However, the range of the scales are twice in units of texts in a month.
I remember during freshman year, I would call my mother at least twice a week. That changed as I became busier and more involved on campus. Now, as I near graduation in a few months, the conversations have become limited to 3-4 words per text.
The average count of words per text is 3.960675.
A quick inspection of the dataset tells us that most texts are the same. When we look up the most common texts
# Most common Texts Sent  #
##                Text Freq
## 1   <Media omitted>  123
## 2             Hanji   65
## 3                👍🏼   29
## 4                Ok   27
## 5  Good morning Mom   18
## 6               Mom   18
## 7               Yep   18
## 8              Okay   15
## 9           Morning   10
## 10            Okay.   10
This seems typical to most of the conversations I have with my mom over WhatsApp. They involve either me sharing pictures I took of events and other things happening at work or around campus. Apart from that it includes a lot acknowledgements. I think I need to re-evaluate my presumed prowess in my communication skills.
On taking a look at the most common texts received:
#Most common Texts Received#
##                 Text Freq
## 1  Missed video call  647
## 2  Missed voice call  253
## 3    <Media omitted>  225
## 4                 Ok   93
## 5  Good Morning beta   71
## 6                👍    55
## 7                😘    23
## 8           R u busy   19
## 9          Where r u   19
## 10      R u in class   17
This does makes me feel guilty as the top two messages are missed call with a wopping frequency of 900. That begs the question... :
Total Messages sent by mom = 2893
Total Messages pertaining to Missed Calls = 647 + 253 = 900
900/2893 = 0.31109
31.11% of her total messages are Missed Calls!

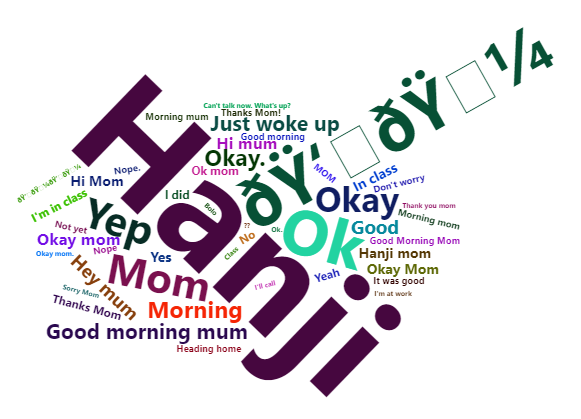
To better visualize my most common reponses to mother, I used a wordcloud. A wordcloud is a collection of words that are depicted in different sizes based upon their frequency. (For context: Hanji is an acknowledgement in Hindi)
 Interactive version for this graph can be found here )
The wordcloud shows the top 50 responses that make up majority of my texts sent to my mother. This data maps almost 3 full years and therefore gives me no excuse to deny the patterns. The responses are almost all either greetings or acknowledgments.
The data visualization allowed me to observe patterns that I wasn't aware of before such as my tendency to reply with 2-3 word long acknowledgments. While this makes texting easier, but it doesn't provide much substance to the conversation which in turn makes me a bad communicator. Contributing to only a 3rd of the conversation doesn't display equal input in the conversations. After completing the data analysis the first thing I did was call my mum and tell her about my findings. She wasn't surprised by the numbers and was relieved that I noticed it. That being said, I don't plan on being monotonous over text anymore with my mother. My goal now is to match the her number of messages by month by making time and talking to her more often than before! 😀